Last Updated on January 11, 2026 by KnownSense
Whenever we build a model, we want to measure its performance—how successful is the model? However, in such fields, the word “success” can have more than one meaning. Therefore, we need to learn about differnent Model Evaluation Metrics.
Classification Metrics
Classification is the task of predicting the class to which input data belongs. One example would be to classify whether the text from an email is spam or not.
Accuracy
Mathematically, accuracy is the number of correct predictions divided by the total number of predictions.
In terms of classification outcomes:
Accuracy= TP+TN / TP+TN+FP+FN
Where:
FN = False Negatives
TP = True Positives
TN = True Negatives
FP = False Positives
Recall, or true positive rate
Recall (also called true positive rate) measures how many of the actual positive cases your model correctly identified as positive. While accuracy looks at overall correctness, recall focuses specifically on not missing positive cases. In other words, out of everything that was actually positive, what percentage did the model catch?
Recall = TP/ TP+FN
False positive rate
FPR measures how many of the actual negative cases your model incorrectly labeled as positive. In other words: Out of everything that was actually negative, what percentage did model wrongly flag as positive.
FPR = FP/ TP+FP
Precision
Precision is the proportion of all the model’s positive predictions that are actually correct. Unlike recall, which focuses on capturing all actual positives, precision emphasizes how reliable the model’s positive predictions are.
Precision = TP/ TP+FP
F1 Score
It is the harmonic mean of precision and recall. By combining both metrics into a single value, it balances their importance and provides a more comprehensive measure of model performance.
F1 Score=2TP/ FP+FN+ 2TP
Logarithmic Loss
It measures how confident and correct a model’s probability predictions are. The metric penalizes wrong predictions more heavily when the model is highly confident about them.
Confusion Matrix
A simple table used to measure how well a classification model is performing. It compares the predictions made by the model with the actual results and shows where the model was right or wrong.

Regression Metrics
Regression metrics are evaluation measures used to assess how well a regression model predicts continuous numerical values. It quantify the difference between the model’s predicted values and the actual observed values.
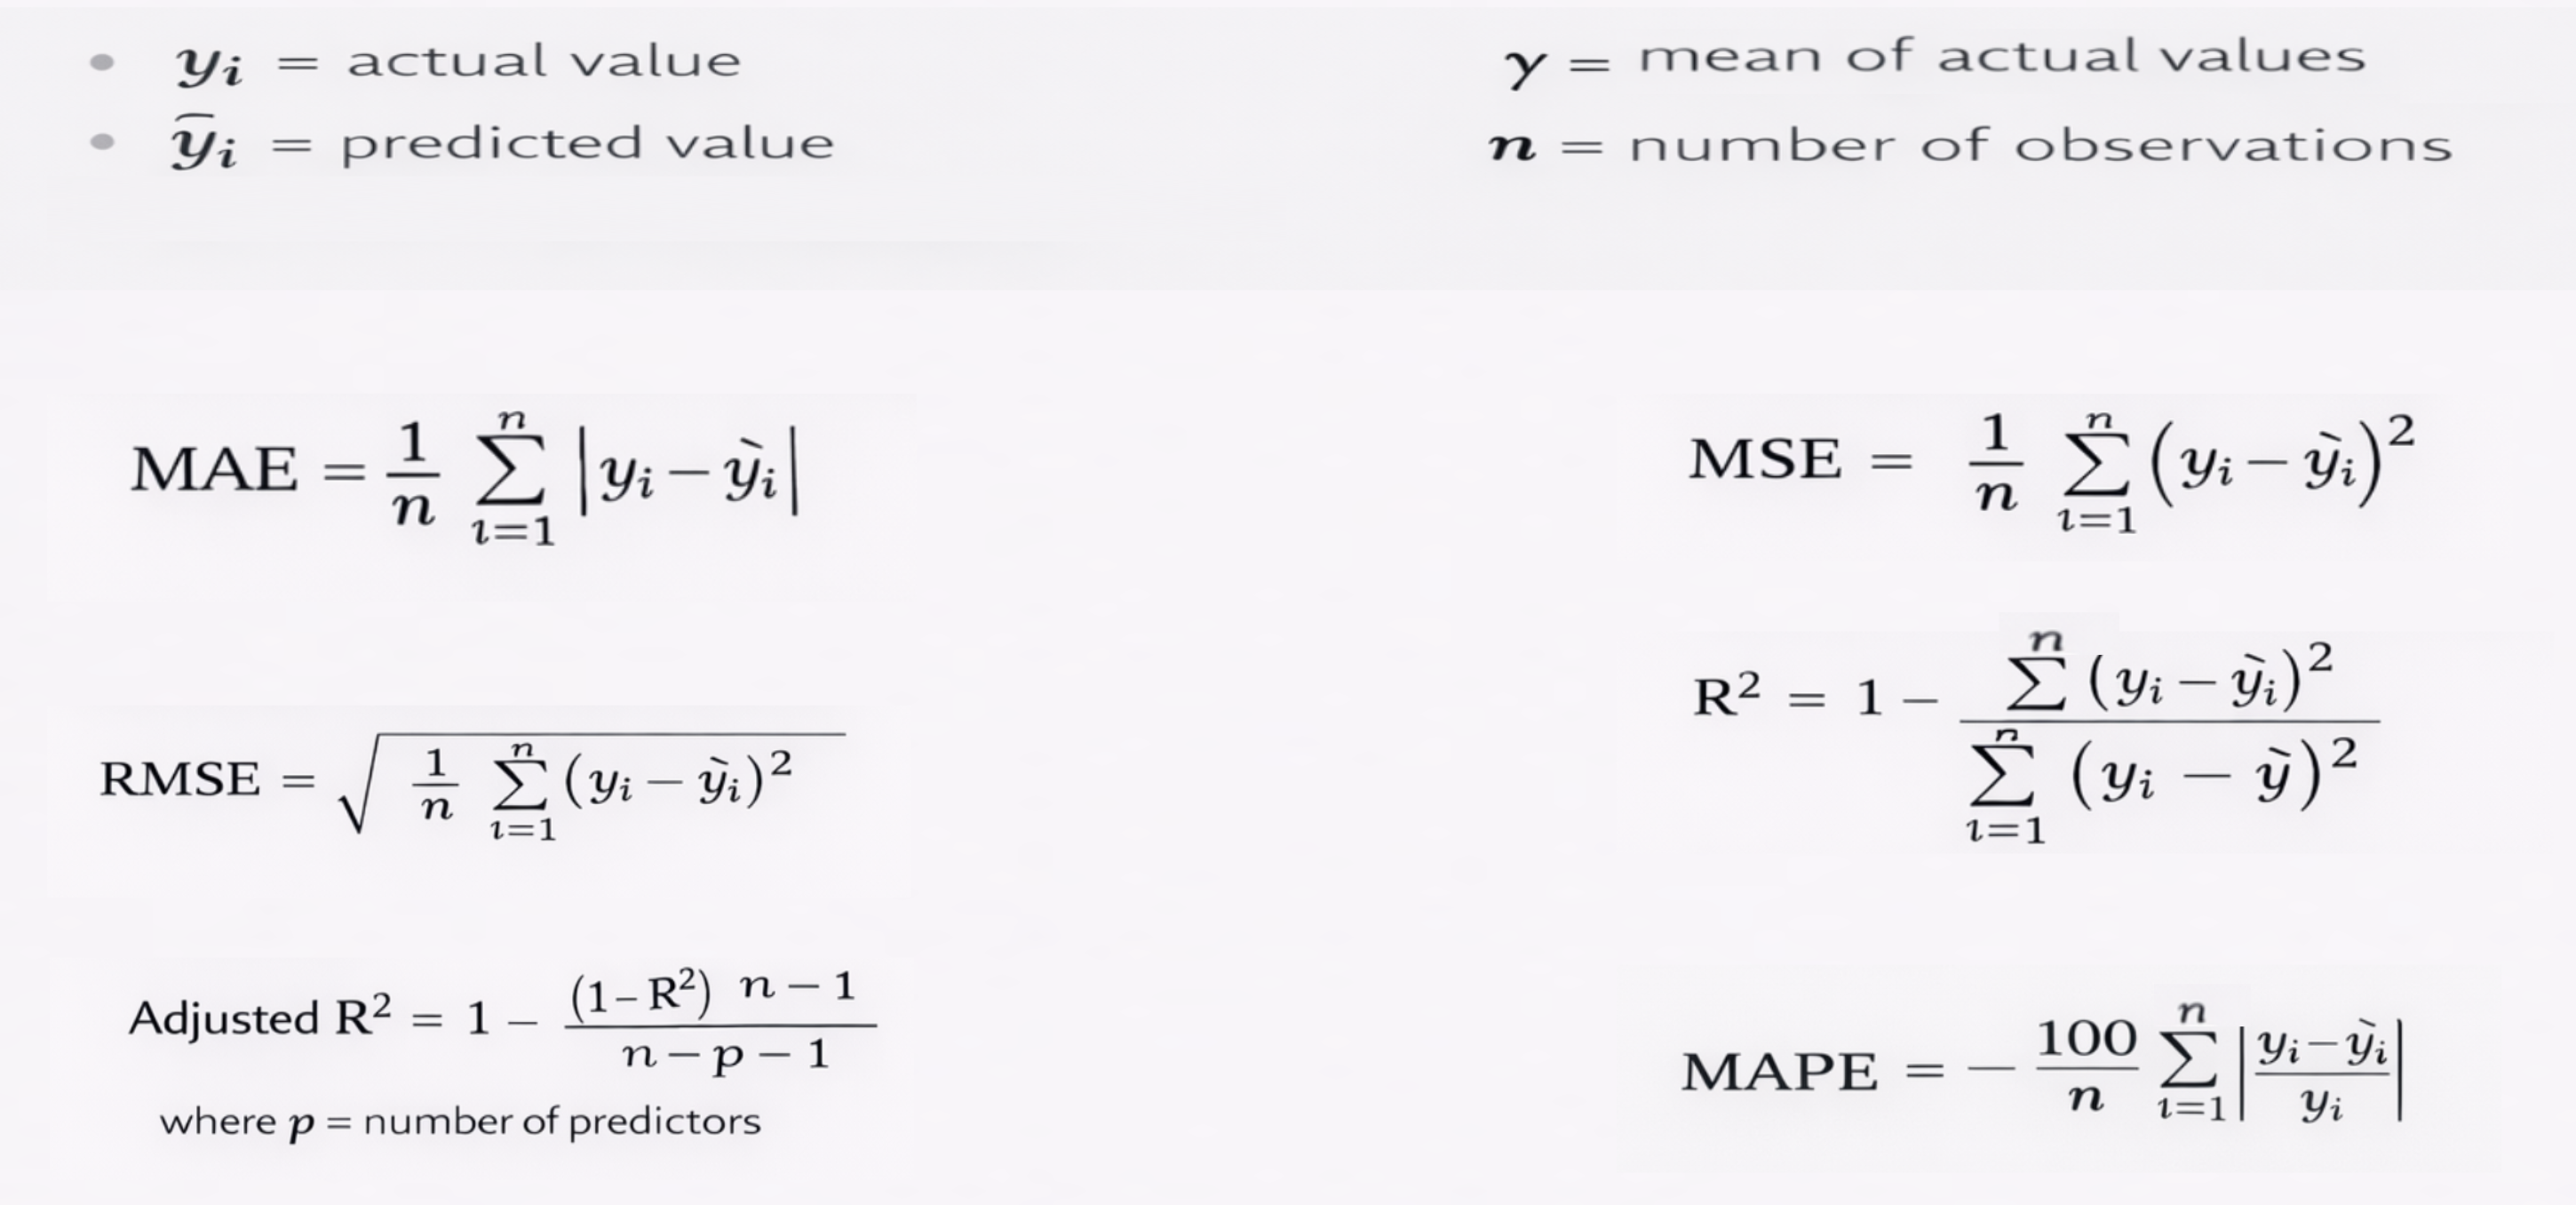
Mean Absolute Error (MAE)
Measures the average absolute difference between predicted and actual values. It treats all errors equally.
Mean Squared Error (MSE)
Measures the average of squared errors. Larger errors are penalized more heavily.
Root Mean Squared Error (RMSE)
The square root of MSE. It is in the same units as the target variable and is easier to interpret.
R² Score (Coefficient of Determination)
Indicates how well the model explains the variance in the target variable. Values closer to 1 indicate better performance.
Adjusted R²
A modified version of R² that accounts for the number of predictors, helping prevent overfitting.
Mean Absolute Percentage Error (MAPE)
Measures prediction error as a percentage. Useful for interpretability but sensitive to zero values.
Regression metrics are essential because no single metric tells the full story, and the choice of metric depends on the problem and business objective.
Clustering Metrics
Clustering is an unsupervised learning technique used to group similar data points together. Evaluation of clustering metrics is difficult due to the absence of true labels but several metrics have been developed like Silhouette Score, Davies-Bouldin Index , Calinski-Harabasz Index and many others.
Conclusion
To conclude, the article shows that model evaluation metrics define what “success” means for a model, and this depends on the task. Next, it outlines key metrics for classification (accuracy, precision, recall, F1), regression (MAE, MSE, RMSE, R²), and clustering (e.g., Silhouette Score).Finally, it emphasizes that no single metric is enough, so we must choose metrics based on the specific problem and business goal.